Ascend
Replaying paragliding flights in 3D and seeing where the thermals keep coming back.
- Status
- live
- Year
- 2026
- Built with
- Svelte 5 · TypeScript · MapLibre · Three.js · Web Workers
Why
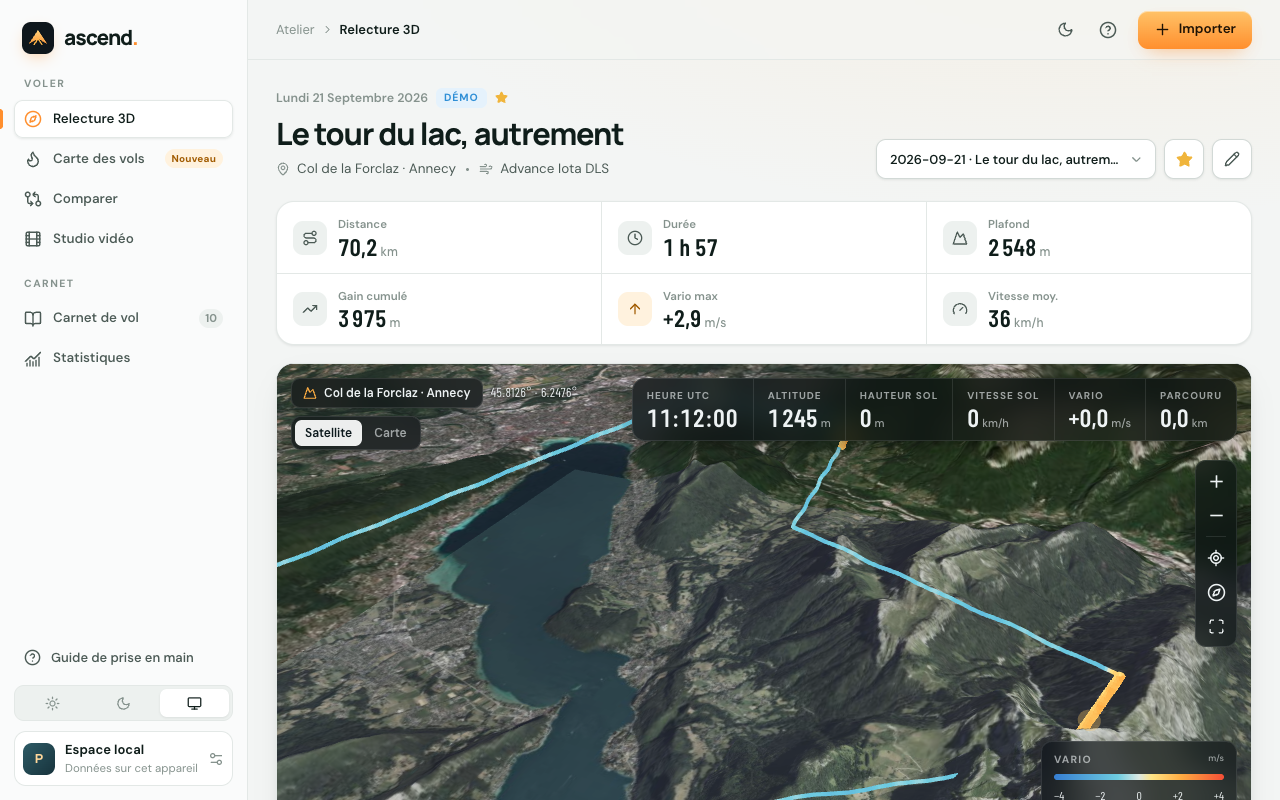
Seeing your flights in 3D gives a better sense of how a flight unfolded: where the climbs were, how the wind made you drift, whether the transitions were good…
How
Everything happens in the browser, with no account. You import IGC or GPX tracks; Web Workers derive position, altitude, ground speed and a vario smoothed over about fifteen seconds, with a single altitude reference per file: GPS if it is complete, pressure otherwise. The trajectory is coloured by the vario and replayed in 3D with MapLibre and Three.js. Four flights can be compared, aligned on take-off time.
Climbs are detected by thresholds: entry at 0.6 m/s, at least 45 seconds and 35 m of gain. A phase that turns at least 0.85 of a full circle, consistently, is classed as a thermal, the others as a climb. Across all flights, a heatmap, and climbs that recur in the same place become hotspots.
One tab estimates the score for the French distance cup (CFD): free distance, flat triangle, FAI triangle, with the rules’ checks. Flights stay in the browser.